Product Usage Platform
Built the data platform behind two product usage dashboards: a scheduled rollup out of MongoDB, one Firestore source of truth, and a static site gated by company sign-in, so the team could stop guessing how the products were being used.
Context
Blue Tees ships two product lines: a launch monitor with its companion app, and the GAME hardware family. Usage data for both existed, but only as raw collections in MongoDB, which meant answering a question required writing a query and then defending it. Almost nobody asked.
The goal was not a prettier chart. It was to make the usage numbers something a non-analyst could reach and trust without me in the room.
Approach
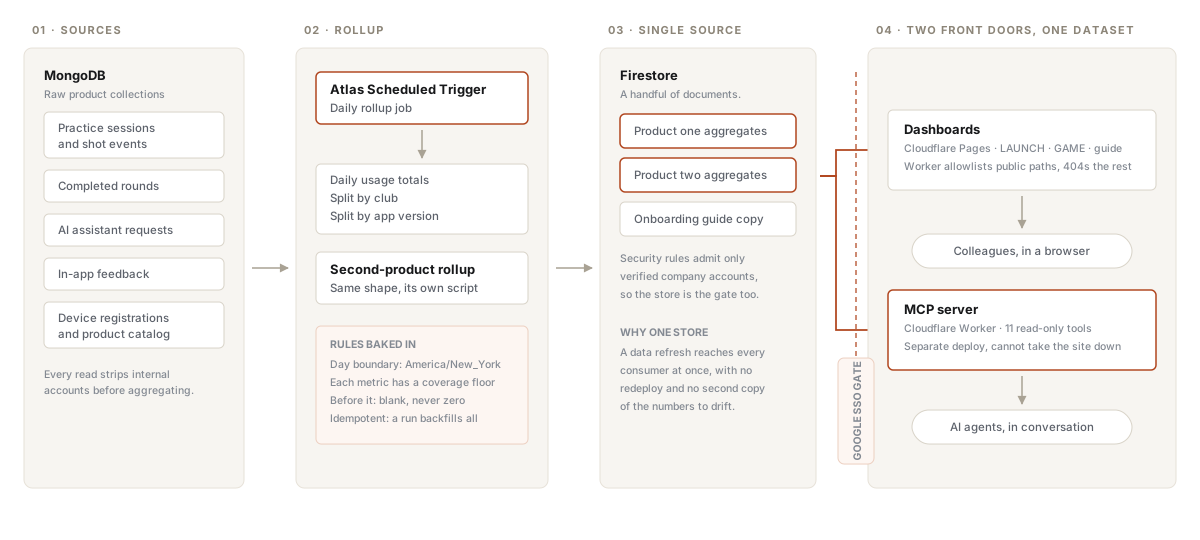
Aggregate once, on a schedule. A MongoDB Atlas scheduled trigger rebuilds daily rollups: overall usage, split by club, split by app version. A companion job does the same for the second product line. Both exclude internal accounts before any aggregation, so the numbers are the customer numbers by construction rather than by remembering to filter. The job is idempotent, so a bug fix is a re-run rather than a migration.
Encode the definitions in the pipeline. The hard part of this data is not the queries, it’s the traps:
- Day boundaries are fixed to one timezone, so a chart and a spreadsheet can’t quietly disagree.
- Each metric family has its own coverage start date. Before that date the rollup writes blank, not zero, so the dashboard can tell “we weren’t measuring yet” apart from “nothing happened”.
- Registered devices exclude the app-side pseudo-products. Leaving them in makes multi-device ownership read as a large majority when the real hardware figure is a small minority, which would have pushed roadmap decisions in the wrong direction.
One store, two front doors. All of it converges on a handful of Firestore documents. The dashboards read them, and so does the MCP server. That narrow waist is why a data refresh costs nothing: no redeploy, no second copy of the numbers, nothing to drift.
Gate it at the store. Firestore security rules admit only verified company
accounts, so the sign-in isn’t decoration on top of an open dataset. The static
site ships a Worker that allowlists the paths allowed to be served and 404s
everything else. Without it, the underlying JSON is fetchable with curl,
straight around the gate.
Outcome
- Two live dashboards covering both product lines, plus a written guide, all behind company sign-in and reachable by anyone with a work account.
- A data refresh is now two commands and touches no HTML.
- The same dataset feeds the MCP server, so the numbers an agent quotes and the numbers on the chart can’t diverge.
Artifacts