Usage Data as an MCP Server
A remote MCP server over the same usage data the dashboards read, so a colleague can ask questions in Claude instead of reading a chart. Designed on the assumption that an AI agent will misread the numbers unless the tool layer stops it.
Context
The dashboards solved reach: anyone at the company could see the usage numbers. They didn’t solve the follow-up question. A chart answers what you thought to plot, and most real product questions arrive as “did that feature actually land?” or “what moved this month, and is it noise?”
Everyone at the company already had Claude. The data was already aggregated and already gated. What was missing was a way for an agent to reach it, and a way to stop the agent being wrong.
The design premise
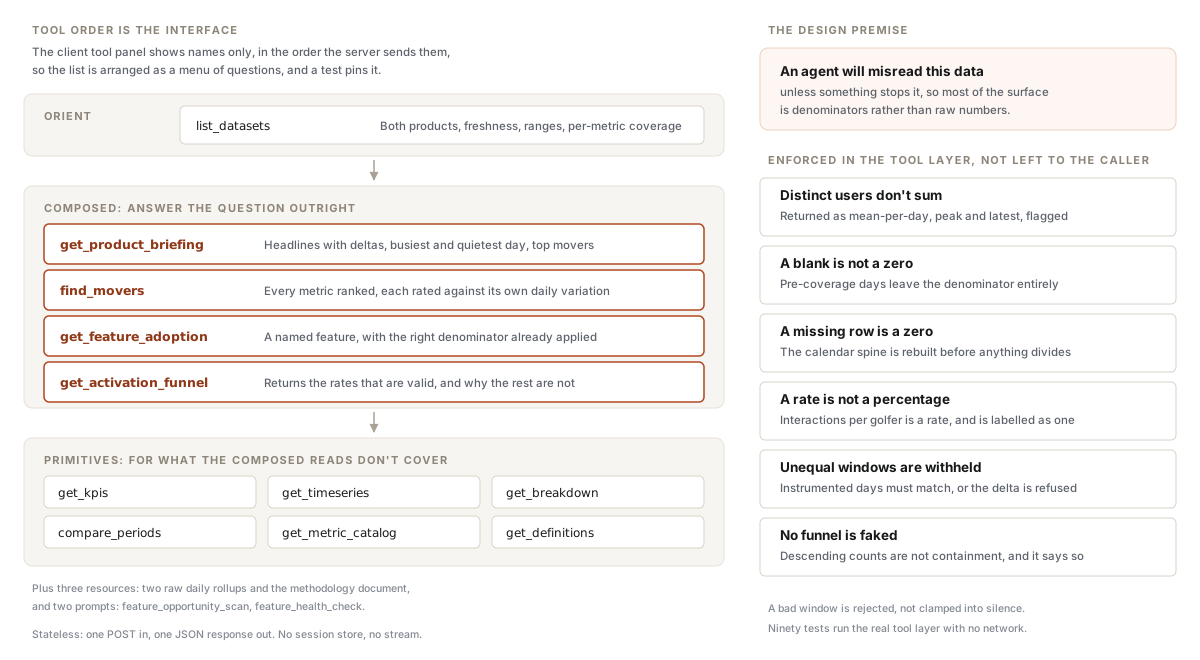
This dataset is easy to misread, and an agent will misread it fluently. Thirty daily active-user counts sum to a number that looks like monthly actives and double-counts every returning golfer. A metric that wasn’t instrumented until last quarter compares against zero and reports a four-figure rise. Counts that descend look like a funnel.
So most of the tool surface is denominators and definitions rather than raw numbers:
- Distinct-user metrics carry no window total. They return mean-per-day, peak and latest, flagged as not summable.
- A blank is not a zero. Each metric has its own coverage start. Days before it leave the denominator rather than counting as zero, and every response carries a coverage block.
- A missing row is a zero. A day with no activity writes no row, so the daily table is put back on a complete calendar spine before anything divides.
- A rate is never dressed as a percentage. A share renders as a percentage only when the numerator is a subset of the denominator. An earlier version got this wrong, and a test pins it now.
- Unequal measurement windows are withheld. If two windows cover a different number of instrumented days, the comparison is excluded and named rather than quietly shipped.
- No funnel is faked. The states descend, and dividing each by the one above is the obvious move, but the sets aren’t nested, so descending counts aren’t containment. The tool returns the two rates that are valid and explains why the rest aren’t derivable.
Product decisions
The tool list is the interface. The client’s tool panel shows names only, no descriptions, in the order the server sends them. That list is the entire product surface for a colleague going looking, so it’s arranged as a menu of questions: orient first, then four composed tools that answer a product question outright, then the primitives, then reference material. A test asserts the order covers every tool exactly once, so a new tool can’t go missing from the menu.
Composed reads before primitives. get_product_briefing answers “how is
this product doing” in one call. Someone who has never seen the dataset
shouldn’t have to assemble that from four primitives and get the denominators
right along the way.
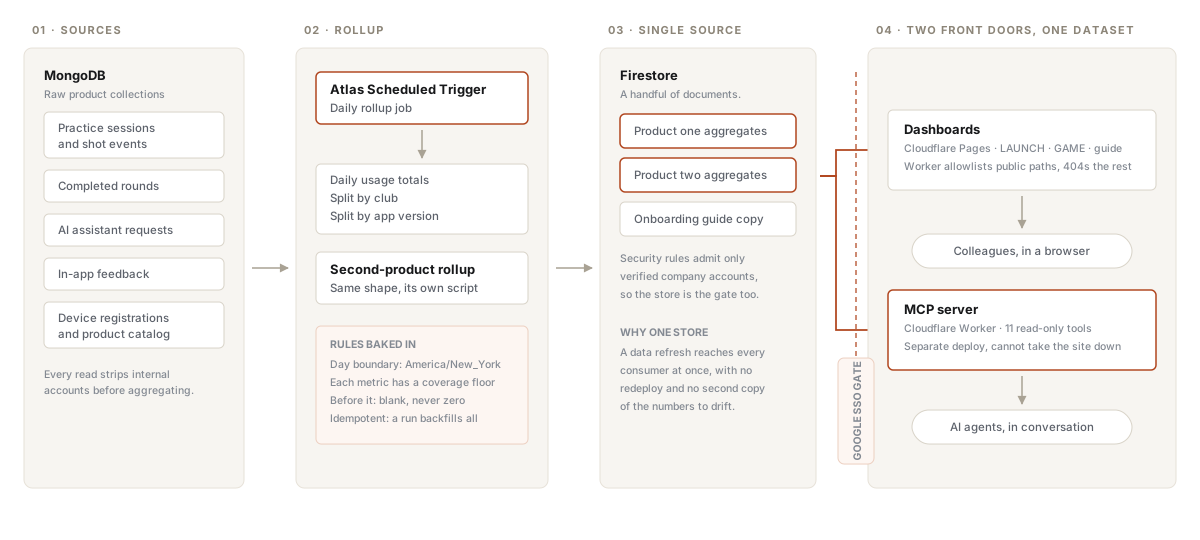
A separate deploy from the dashboards. The dashboard site auto-deploys on merge. Keeping the server independent means an MCP change can’t take the dashboards down, and vice versa.
The sign-in is enforced, not hinted. The domain hint on a Google authorize URL is something a user can edit out of the address bar. Admission is decided server-side from the returned claims: audience, issuer, expiry, verified email, domain claim and address suffix. The auth tests cover the bypass attempts, including a personal account presenting the right domain claim and lookalike domains.
There’s a consent screen. A server that proxies to an upstream identity provider without its own consent step can be walked through the whole flow by a client the user never agreed to. The screen names the client and the host tokens will be sent to, with a warning when that host is loopback, which is what a local agent looks like and also what a hostile local process looks like.
Outcome
- Eleven read-only tools, three resources and two prompts, live behind the same company sign-in as the dashboards. Nothing to hand out but a URL.
- Ninety tests run the real tool layer and the real protocol handler against committed fixtures, with no cloud and no network.
- A data refresh reaches the server within the cache TTL. No second deploy, no second copy of the numbers.
Artifacts